
[Focus 1a] Approaches to SamplingWhat is a sample?6 different sampling methods. Data collected over time |
What is a sample and what is a representative sample ?
A
concept that is very important to grasp is that in reality, you are never going
to be able to collect
more than a tiny proportion of all the potential
data that might apply to the work in hand. You will invariably only have a proportion
(i.e sample) of all that is possible to work on.
A
sample may be defined as a group or set of representative individuals (values
or readings) taken from larger groups. This larger group is referred to as the
parent or statistical population. Note also that
it is quite reasonable to talk about a population of values (of a given variable)
rather than restricting the term only to individuals. Once we have this representative
sample, we can then use it to gain information about its distribution, the estimates
of its parameters (e.g mean and standard deviation
etc) and even testing the
sample against a particular hypothesis that we have suggested.
The
population might be defined as: all those individuals (or items) that might
exhibit sufficiently
similar characteristics to allow us to examine them on
an equal basis. If we were studying the
spending habits of Dorset shoppers
for example, it would be legitimate to compare the behaviour of people from different
towns and one may also wish to enlarge the 'population' under scrutiny by adding
in the results from another county but there would be little point in comparing
their purchasing habits with say, Eskimos. The term 'population' must be defined
fully in each project undertaken. It is useful, before attempting to collect samples
from a population to clearly define (and place boundaries upon) your population.
Think of this as defining your target population.
| Invariably, practical issues
of time, budgets, staffing and equipment will dictate just how much data can be
collected for any given investigation |
Another common term encountered is Groups...a group may be defined as a subdivision of a population that exhibits a specific character (or characteristic) which sets them apart but still entitles them to a place within a wider population. In some cases we may talk about a sampling frame and this refers to a set of characteristics, the boundaries of which represent the field from which our samples will be taken.
Below:
The green square represents the sampling frame and contains many potential samples. Each sample contains n individuals, preferably selected at random from all those individuals within the sampling frame..
| WHOLE POPULATION
|
Here is a further representation of the same concept. Note that in the population there will be variability (here represented as slightly different shapes to all the elements) both between and within the samples. Similarly, there will be variability within and between the population elements.
The sampling method and sample size have to be carefully considered to ensure that they represent the true characteristics of the population as far as is practicable.
Some text books draw a distinction between probability sampling (where each individual (element) has a calculable probability of being included in the sample and non-probability sampling, which ultimately depends upon personal preference. Furthermore, sampling error (use the Glossary) can be calculated in the former case but not in the latter.
Q. So what is a representative sample?
A. A randomly chosen sample is always the 'fairest' sampling strategy to employ because it should mean that every single item / individual within a population has an equal chance of being chosen for scrutiny as every other item / individual in that population.
There are many different sampling methods but we will only consider just 6 the first two are non-probability methods but 3 - 6 are the more robust probability methods....
1)
Convenience (or Grab) Sampling
Very opportunistic and susceptible to
bias. Surveys of people in the street or collecting different brands of Cola cans
in a country park would fall into this category. The data collected would depend
entirely on the convenience to the collector. This is a haphazard way to do things.
One aspect of any good project design brief is that the work should always be
capable of accurate replication by others. Grab sampling would be outside of this
constraint. Eg. a researcher simply asks the people he works with in the office
to fill out a questionnaire.
2)
Judgmental Sampling
Similar to 1) but here the researcher tries to
use his/her prior knowledge to 'select' what he/she considers to be the most suitable
candidates to become members of the sample. Again, this technique is compromised
by personal bias. Eg. a researcher measuring the interest in health foods stands
in the doorway of the health food shop and only asks people going in!
3)
Systematic Sampling
Here, an attempt is made to use some mathematical
deduction to reduce the data to a more manageable size without losing any meaningful
'depth' to that data. E.g...
 The population
of the village of Melton Abbas is 2100. The District
Council are to carry out an opinion survey concerning a proposed new by-pass.
The market research company intend to interview at least 210 people because
they consider that 10% would be a representative sample. The village comprises
600 houses spread over 12 streets. The researchers are aware that some streets
would be more affected by a by-pass than others.
The population
of the village of Melton Abbas is 2100. The District
Council are to carry out an opinion survey concerning a proposed new by-pass.
The market research company intend to interview at least 210 people because
they consider that 10% would be a representative sample. The village comprises
600 houses spread over 12 streets. The researchers are aware that some streets
would be more affected by a by-pass than others.
So, 2100 people in 600 houses >>> 3.5 people per household. 210 people to interview = approximately 60 households. We could simply interview all of one street and 10 houses in the next.
Q. Why would this be considered unacceptable?
In order therefore to reduce bias and to be systematic; the team decide that 5 households should be interviewed in each street. Then randomly choose the first number between 1 and 10, say 2. Then select each tenth one after that until 5 have been selected i.e. House numbers 2,12, 22, 32 and 42 in each of the twelve streets.
Q. Some houses are single occupancy; how would you compensate for this fact?
Q. What other course of action might give a better result?
4)
Simple Random Sampling
Here, all individuals in a population (take
care to define what is the population) have an equal chance of being selected.
Random number generators are utilised to 'choose' which individuals to include
in the sample (from within the frame).
 Imagine that there are 945 registered Chinese restaurants in London. We want to
compare the prices of a random sample of 30 of them. First, each restaurant
is allocated a number.
Imagine that there are 945 registered Chinese restaurants in London. We want to
compare the prices of a random sample of 30 of them. First, each restaurant
is allocated a number.
A random number generator will solve the problem....
(taken from tables)
| 81668 |
75363 |
62126 |
65806 |
70028 |
30458 |
17405 |
We are working in hundreds [945] so 3 digits will suffice. There is an equal chance of any number between 001 and 945 being selected. If a number appears twice, the second appearance is discarded.
Our random selection will now be:
| 816 |
687 |
536 |
362 |
126 |
658 |
067 |
002 |
830 | 458 |
174 |
etc etc, until 30 have been selected. These are then the restaurants selected for inspection.
The important element here is to understand that bias ('the human element') has been removed from the selection process.
5)
Stratified Random Sampling
It may be necessary to modify the above
approach to make certain that the samples are suitably balanced. This becomes
necessary when a population consists of clearly divided categories and you wish
to ensure that each category is properly represented in your sampling process.
The aim is to recognise that the population is divisible into 'sets'. This may
appear to be somewhat artificial but can usually be done by separating out one
distinguishing feature.
Let us suppose that the Institute of Personnel Management has 1000 registered members in Hampshire and a survey requires 40 to be interviewed about their work. However, 300 work for Public companies and 700 work in Private Partnerships.
Proportional representation would require 300÷1000 x 40 = 12 representatives from the Public companies and 700÷1000 x 40 = 28 from the private partnerships to reflect the ratio displayed in the whole population of 1000.
Proportionality must be a consideration ...
In the earlier restaurant example for instance, the type of restaurant
may be important.
| Type: |
Number
of Restaurants | Representative
sample (to =30) |
| 'Take
Away' | 490 |
16 |
| Low
Budget | 291 |
9 |
| High
Class | 164 |
5 |
| TOTALS |
945 |
30 |
490/945 x 30 = 15.6 =16 etc
We would now use random numbers again to select the samples to be used from each category.
6)
Cluster Sampling
Here
the population is divided into many subsets, clusters or groups, again
based on some observable classification. Then, only some
of the subsets are examined (they should still be chosen randomly)
further whilst the remainder are discarded.
 A National opinion survey has set out to find the nations' favourite BBCTV programme...
They have listed 35 shows in 7 categories....11 comedy series, 7 current affairs programmes, 9 'soaps', 2 sports programmes, 2 children's series, 3 wildlife shows and one documentary! It may be decided that although they all belong to the same Company, we only have facilities to examine 4 categories from the above selection. The 4 from 7 must be selected at random though.
Another illustration might be to consider all the employees of an international bank to be a 'cluster sample' of all the employees of the various banks in the same area. We might consider the employees working at JP Morgan Chase in Bournemouth as a representative sample for all the banks in Bournemouth.
Task: Outline the weaknesses of this system of sampling.
|
Often constraints such as time, money, accessibility and equipment resources will determine the final design. You will never be given unlimited time and / or money to carry out business research. There will always be 'deadlines' to meet. Therefore it is likely that compromises will have to be made. The final goal of the research must never be pre-empted but it is equally important that the overall purpose of the investigation is kept uppermost in one's mind.
|
 A national chain of shoe retailers, Nuboots Ltd,
has just opened a branch in Bournemouth for the first time. An expensive marketing
and awareness campaign has just ended and head office are keen to know how effective
it has been. You are under pressure to produce accurate results as quickly and
as economically as possible. Here is the work plan outlining how the task should
progress and showing where possible economies of time and money might be made:
A national chain of shoe retailers, Nuboots Ltd,
has just opened a branch in Bournemouth for the first time. An expensive marketing
and awareness campaign has just ended and head office are keen to know how effective
it has been. You are under pressure to produce accurate results as quickly and
as economically as possible. Here is the work plan outlining how the task should
progress and showing where possible economies of time and money might be made:
Stage |
Task | Comment |
| 1 | A map is used to define the total area and population from which the shop might expect to attract customers | Prior market research needed? |
| 2 | The total area is sub-divided into segments reflecting residential, industrial and business zones | Use of mapping techniques |
| 3 | Each segment is coded | Data handling begins |
| 4 | A predetermined and limited number of segment are selected on a random or systematic basis | Realistic constraints of time and money applied here. Compromise 1 |
| 5 | All residences within those segment that were selected are numbered | |
| 6 | A predetermined and limited number of residences are selected on a random or systematic basis | Realistic constraints of time and money applied here. Compromise 2 |
| 7 | Individuals within the selected residences are sought for interview. Then only the main income provider is interviewed . |
Compromise 3 |
Task: Your team has been asked to carry out a traffic survey for the Borough of Christchurch. What variables are you going to measure? How will you determine your sampling methods? What constraints are you placing upon your survey?
Now produce a realistic and detailed work plan. You should identify at least 6 stages.
(see also Focus 9)
Most surveys attempt to 'capture the moment', in other words, we are looking for a summary picture of a given situation at a specific moment in time. Opinion polls are of little use once they are out of date for example. However, sometimes it is exactly that element of 'change' that we want to investigate.
We looked at data collected over time in the example about unemployment levels but it is possible to consider many other scenarios that have 'time' as one of the variables.
Some market research programmes seek to discover just how something (the dependent variable) changes over a period of time. The uptake or acceptability of a new product for example or radio listening figures each month. Note that using Interval or Ratio data is much easier in this context than Nominal or Ordinal data.
Consider a survey that investigates the number of people watching television at
different times of the day.
The
24 hour day could be divided into 8 x 3 hour segments, starting at midnight.
These are the figures (Ratio data) for a specific day (a Tuesday) in October 2005....
| (At the end of) Period.... |
1 | 2 |
3 |
4 |
5 |
6 |
7 |
8 |
| Number of viewers (Millions) | 2.65 | 0.30 | 4.85 | 3.30 | 4.70 | 5.85 | 11.90 | 13.65 |
This form of data collection is readily converted to graphic form and can give us a visual representation of a 'pattern of change over time'.
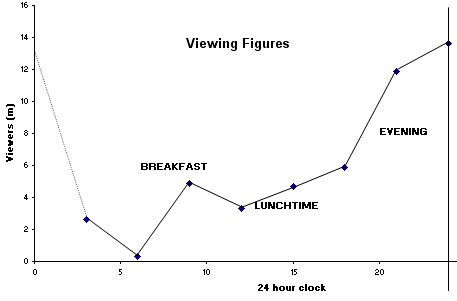
Q. What conclusions can be drawn already about the UK viewing habits from the above chart? How might a TV company use such data?
Q. What limitations can you suggest exist here that prevent a more meaningful analysis being undertaken?
This leads us to the idea of analysis over longer periods of time in order that 'trends' can be discerned. Thus a time-series analysis (see Focus 9 for much more on this subject) is slightly different in that the time periods (of observation) involved are usually much longer so that any periodicity (repeating patterns) have an opportunity to show themselves. Thus......
Q. Do viewing numbers show trends over a one week, or one month cycle and do they fluctuate seasonally?.
Even if they do, the plotting of the data would follow the same procedure.
![]()