
[Reasons
for using statistics]
Handling Numerical Data Effectively
|
[Believe
it or not....We do it all the time !!]
"Working with numbers is just part of ordinary life"
 We
live in a world where facts and figures abound. In our daily lives, at home and
at work, we have to constantly assess numerical information and make rapid deductions
from that information. In an age of mass communication, we are also bombarded
with data from TV, radio and newspapers. How do we judge, assess, sift, weigh
or digest this information? It is certain that we cannot be an expert in all things
and therefore much of what we are told has to be taken at 'face value'. This also
places a large responsibility upon those who collect and work with data (intended
for others) to understand how that data was derived, where it came from, it's
validity and how it is presented to the listener or reader.
We
live in a world where facts and figures abound. In our daily lives, at home and
at work, we have to constantly assess numerical information and make rapid deductions
from that information. In an age of mass communication, we are also bombarded
with data from TV, radio and newspapers. How do we judge, assess, sift, weigh
or digest this information? It is certain that we cannot be an expert in all things
and therefore much of what we are told has to be taken at 'face value'. This also
places a large responsibility upon those who collect and work with data (intended
for others) to understand how that data was derived, where it came from, it's
validity and how it is presented to the listener or reader.
A
large part of the media world is concerned with collecting opinions from the general
public, government spokesmen, visitors, shoppers and subject specialists.
To
condense many (sometimes disparate) opinions into faithful deductions is a delicate
and responsible task. The mathematical rules governing the analysis of numerical
data can help to ensure that the inferences made have some statistical legitimacy. |
Now
we need a definition: essentially STATISTICS is concerned
with the collection, presentation, analysis and interpretation on numerical data.
The subject is usually divided into two parts, Descriptive
or Exploratory Statistics involves describing and summarising data. Then
there is Inferential Statistics where we try to go
beyond basic logging and 'pidgeon-holeing' and try to draw inferences about a
population based upon results collected from a representative sample.
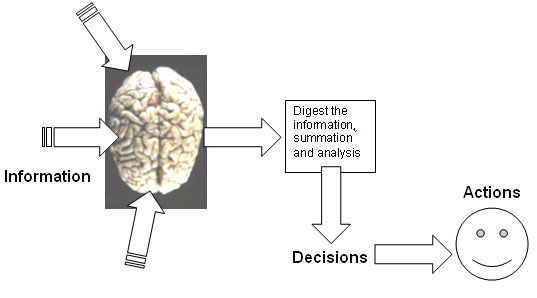
Our
brain likes numbers and pictures more than words!
We
make mental calculations all the time ...and often subconsciously.... How many
bread rolls to buy? How much is a round of drinks going to be? How much petrol
do I need? How much money is in my bank account? etc. etc.
 All information can be divided into one of two categories: qualitative
and quantitative. Qualitative information uses language , particularly
descriptive words to convey ideas and meaning and this has been the foundation
of all human communication. However, quantitative information is much more specific....how
many? how big? how fast? how expensive?
All information can be divided into one of two categories: qualitative
and quantitative. Qualitative information uses language , particularly
descriptive words to convey ideas and meaning and this has been the foundation
of all human communication. However, quantitative information is much more specific....how
many? how big? how fast? how expensive?
| In
evolutionary terms; it would have been far more important for a prehistoric hunter
to know how many antelope were in the herd and how fast they could
run rather than whether or not their fur was soft or the colour of their eyes. |
One
of the great strengths of quantitative information is that it can be compared
with other related information over time and space
and, if used properly and with care; with little or no bias.
Compare
the following two comparisons of a new sports car.....
|
 (1)
"The new Frangio ML 6 looks beautiful with
it's 'march marigold' paintwork, it's high tension layered and multi-fractile
beam headlights, swan-like wing mirrors, the iconic grille and the quadruple manifold
titanium exhausts. On the road the car handles like a well-bred stallion and just
laughs at reverse cambers. The bi-lateral braking system was especially designed
to stop on a sixpence and the steering will take you to heaven. The cossett leather
upholstery welcomes you and begs you to snuggle deeper into the warm rarified
atmosphere of the plastex cockpit". etc etc etc! (1)
"The new Frangio ML 6 looks beautiful with
it's 'march marigold' paintwork, it's high tension layered and multi-fractile
beam headlights, swan-like wing mirrors, the iconic grille and the quadruple manifold
titanium exhausts. On the road the car handles like a well-bred stallion and just
laughs at reverse cambers. The bi-lateral braking system was especially designed
to stop on a sixpence and the steering will take you to heaven. The cossett leather
upholstery welcomes you and begs you to snuggle deeper into the warm rarified
atmosphere of the plastex cockpit". etc etc etc!
(2)
The Frangio ML 6: (£48675 on the road). 2-door,
6-cylinder 3.2 litre injected engine, 177 brake horse power, 20cm disc brakes
all round, top speed 141mph. Depreciation: 3 years 56%. Fuel consumption: (urban
cycle: 16 m.p.g.). Insurance group 17. |
The
first description is virtually useless, it is highly subjective and is just one
person's (highly biased) opinion of the car but tells us very little about the
true nature of the machine. Of course, qualitative information does not have
to be subjective but can be reasonably objective...
Yellow
paintwork, ventilated disc brakes, chrome headlights,
black leather seats,
deep pile carpets, chrome door fittings,
low-profile tyres and alloy wheels. |
This
is better but still requires the reader to interpret what is meant by 'yellow'
for example (see below). Sometimes, adverbs such as 'very' or prefixes
such as 'super' are added to descriptions to add some concept of scale or magnitude:
"very fast", "very expensive", "super-smooth" etc
. Adjectives such as 'big', 'little' 'slow', 'fast' or 'beautiful' may also be
used in descriptive text but this is all still very subjective and as such, open
to interpretation, opinion and debate.The
second description, whilst being very dry and humourless, tells us far more in
three lines than the first description did in 6! With the second description,
we also have the opportunity to compare this car with the specifications of any
other car. This is not a practical proposition if we use the first description
method.
There are other
problems with qualitative data.....
| We saw an image of a yellow
car and we can see one radiator grille, two headlights and two wing mirrors.....
Such a description is exact as far as the grille, the number of headlights and
wing mirrors are concerned but is highly subjective as far as colour is concerned.
What is Yellow? What if your eyesight is not perfect? What type of computer
screen are you using etc. So qualitative information is always subject
to personal interpretation.....the numerical information given is clearly defined,
unambiguous and is not subject to interpretation. |
Task:
Describe as ACCURATELY as possible what you see in the picture below:
It
may be easy to give a brief descriptive account of what we see, even where numerical
information is involved, but to accurately quantify is much more difficult.
Our eyes are able to pass summary
information to the brain with incredible speed but with certain limitations.....Small
numbers are quite easy (how many people?, how many
chairs?) quite hard (how many purple flowers?) almost
impossible (how many blades of grass?).
Using
statistical methods; small data sets (<25 pieces of data) can be dealt with
using simple techniques to 'describe' what the data represents to us (means, increase
/ decrease in magnitude or simply 'changing') but when datasets grow beyond 25;
we have to use other methods to 'reduce' the data down to a component that is
manageable for our brains.
The
idea of 'Statistical Analysis'
We
have already noted that we do many hundreds of minor calculations in our heads
each day and they help us to understand the world around us. Our brain has evolved
to cope with quantitative information remarkably well. These subconscious calculations
can sometimes be quite advanced and use multiplication,division and proportions
just as readily as addition and subtraction. They also rely upon previous experience
and numerical memory. The outcome will be a deduction and possibly a consequential
action......
An
example.....
Let us imagine we are preparing for a car journey from Bournemouth to London.
Is simply guessing the amount of petrol needed for the journey such a good
idea? No!
Surely
it would be better to have some means of estimating the required quantity
in order that we don't run out before getting there!! For this to work, we need
access to certain prior numerical data. In this case,
an accurate measure of the distance involved and an approximation of the number
of miles per gallon that the car will do.
The
manufacturer of the car will have carried out numerous road tests i.e. Experiments
(under many driving conditions) to give an 'average' (be very careful of this
word!!) figure for the petrol consumption for that model. You might say that the
'experiment' to establish the average mpg has been replicated many times and so
any average mpg figure has been based on a range of results that have been 'condensed'
to yield just one figure...the average mpg. Because
the figure has been arrived at in a logical and repeatable way, we should have
some faith in its accuracy albeit that we are putting our trust in work carried
out by others.
Also
note that our car is only a sample and so were the
few cars actually tested at the factory. The 'population' from which these
samples were taken would be every single example of that model built to the same
specification. This could be tens of thousands of vehicles and it is clearly impossible
to check the fuel consumption of each and every one of them.
Now
we are beginning to think "How typical is my car?, How closely does it conform
to the specifications of all the examples of this model?, Has it been modified
or possibly neglected?" These 'factors' may affect the fuel consumption of
just this one sample. Inevitably, we are going to have to make an inference
about the car based on values derived from other cars and not actually on the
one we are using. So in order to make an inference about the amount of petrol
to buy.... we need to do a little mental arithmetic.
The
handbook said that this model will achieve 30 mpg.....
So
...120 miles @ 30 mpg = 4 gallons needed.
Whilst the
calculation is precise the conclusion may be inaccurate. We may be held up in
traffic, the car engine may not be running at peak efficiency or we may just have
a heavy right foot!!!! Our brains seem to have an amazing ability to adjust mathematical
data with no apparent effort. The likelihood therefore is that we would buy 5
gallons of fuel, "just to be on the safe side". In essence what happened
here was that our brain said "I know that 4 gallons should be sufficient
but how confident can I be that the result is correct?
In
general conversation we might use a phrase such as:
"I
am 90% confident that my car would make it on 4 gallons but I can't be 100% sure"
 |
In formal statistics, such use of "90%" would have a far
more precise meaning and would involve the use of some recognised
inferential test to establish whether or not we are really justified
in saying that something is 90% certain to happen. In
other words, we need to ask "what is the mathematical likelihood that the
results of my estimations are in fact the true state of affairs?"
We could set an arbitrary 'cut-off' point at say, 90%. This
would lead us on to say: " If I did this journey 10 times, I
am totally confident that the car would complete the journey successfully
nine times ....I would fail to get there one time in ten. |
Probability
theory is often difficult to grasp but essentially we are looking at the chance
of an event (outcome) taking place. We can measure this as a proportion on a scale
of 0 to 1 or as a percentage from 0% to 100%. We are drawing a distinction between
something happening by random chance and the same event happening because some
agent 'caused' it to happen.
So
what is the chance of that one in ten 'disaster' journey happening on this particular
trip?
| These
are the kind of 'odds' that gamblers and investors have to make all the time.
They have to weigh the chances of success with the likelihood of failure. Fortunately,
investors do have some statistical 'tools' to help them make value judgment. |
In reality what our brain
tells us is that we don't want to run the risk that this journey will be that
'one in ten' and therefore we say... "I am not sufficiently happy with the
odds to take the risk and therefore I will buy 5 gallons instead". By doing
this we effectively reduce the odds to such a point that we consider the risk
of running out of petrol to be negligible.
Our
confidence in the likely outcome is approaching 100%!
WE
HAVE MANIPULATED RECEIVED AND EXPERIENTIAL DATA TO ACHIEVE A SATISFACTORY OUTPUT!
Statistics and the advertising
industry
 For the advertising executive, numerical data comes from consumer surveys, fees,
budgets, sales figures, market share figures, feedback surveys and competitor
data. The analysis may be complex but the end goal is to justify the expenditure
made in order to promote the specific goods or services. These documents must
then represent the 'snapshot' view of the success (or otherwise!) of the campaign.
For the advertising executive, numerical data comes from consumer surveys, fees,
budgets, sales figures, market share figures, feedback surveys and competitor
data. The analysis may be complex but the end goal is to justify the expenditure
made in order to promote the specific goods or services. These documents must
then represent the 'snapshot' view of the success (or otherwise!) of the campaign.
The
statistics can be also be used as a management tool to aid future decision-taking
and to provide the management with accurate information so that they may guide
the company's affairs successfully. Quite complicated issues can be helped by
accurate collection of data and subsequent analysis. For example: How best to
allocate advertising budgets when there is a range of products to promote.
Cautionary
note: All data and examples given in the following pages relate to possible
real situations but the data used has been constructed for illustrative purposes
and should not be used to infer actual recorded measurements or policies.

Back
to Home Page
Go
to 'Quick View' Contents Page
Go
on to: Overview to 'Descriptive
Statistics'
Ready
to start?.....