
[Focus 3 b]Bar Charts and Boxplots(when working with SPSS) |
 The following transactions have been recorded on an automatic cash dispenser.
The dispenser issues money in the following amounts; £10, £20, £30,
£40, £50 and then multiples of £50 to a maximum of £200.......
The following transactions have been recorded on an automatic cash dispenser.
The dispenser issues money in the following amounts; £10, £20, £30,
£40, £50 and then multiples of £50 to a maximum of £200.......
| Value
of Transaction (x) | Number
of Transactions (f) | Cumulative
(CF) | fx
| |
| 10 |
46 |
46 |
460 | |
| 20 |
57 |
103 (46
+ 57 etc) | 1140 | |
| 30 |
68 |
171 |
2040 | |
| 40 |
56 |
227 |
2240 | |
| 50 |
47 |
274 |
2350 | |
| 100 |
39 |
313 |
3900 | |
| 200 |
34 |
347 |
6800 | |
| | Totals : | 347
(n) |
347 |
16690 |
It should be noted that the data in the 'Value of Transaction' (first column) is discrete and does not represent continuous data. Each transaction is independent of any other.
This example will illustrate the use of frequencies of occurrence to draw a bar chart.
Open SPSS and go to variable view. Name the two variables as 'transact' and 'value'.
Reduce the 'decimal' column values to zero. In the 'Labels' column; write the full titling for each variable (word these as you would wish them to appear on the final bar chart).
Switch to data view and enter the data given above. Go the 'Graphs' and in the drop-down menu, select 'Bar'
Select 'Simple' and 'Individual cases' Transfer the variables as shown in the screen grab below:
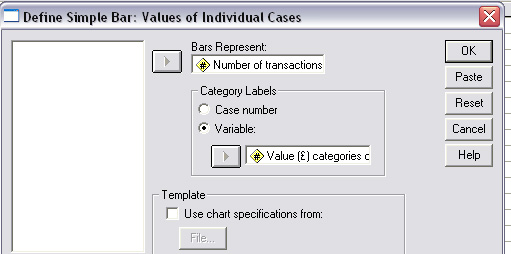
Click 'Ok'
The following output will be derived:
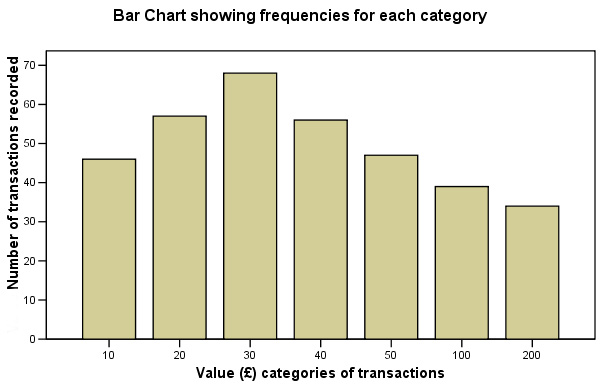
The modal value can clearly be seen to be the £30 category.
The mean will be the sum of the fx values (16690) divided by the total number of observations (347) = £48.10 but is not of interest to us in this calculation.
The median value will be the (n +1) ÷ 2 = 348 ÷ 2 = the 174th value and this falls at the top of the £30 category. The £30 - £39.99 class runs from observation 103 to 179 and we want the value for the position at observation 174.
The
full calculation is: 174 - 103 =
71 x £40 =
£37.37
179 - 103 76
Here is a similar but more involved example:
 The
Daily Clarion has commissioned an 'undercover' investigation
looking at the safety standards of fairground rides in the UK. 56 Roller Coaster
rides were checked. The investigators recorded the number of serious faults noted
on each installation. The individual operators were then told that the team would
return in 21 days along with safety officials to see how many of the faults had
been repaired.
The
Daily Clarion has commissioned an 'undercover' investigation
looking at the safety standards of fairground rides in the UK. 56 Roller Coaster
rides were checked. The investigators recorded the number of serious faults noted
on each installation. The individual operators were then told that the team would
return in 21 days along with safety officials to see how many of the faults had
been repaired.
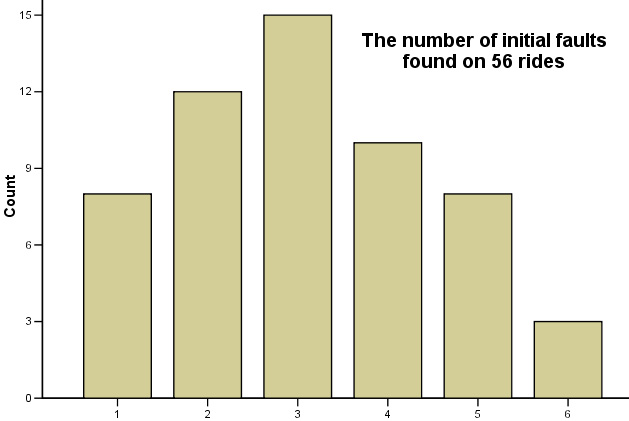
Before reading on, think about how best to display the data that is about to be collected. Note that it is discrete date (Why?) and therefore we must use bar charts NOT histograms. Note that we are simply recording the number of faults and not trying to gauge or classify their severity.
Number of initial faults (Range 0- 6)
| Initial
faults (I) |
Number
of cases(f) |
(f)
x (I) | ||||||||||||||||
| 1 |
1 |
1 |
1 |
1 |
1 |
1 |
1 |
8 | 8 | |||||||||
| 2 |
2 |
2 |
2 |
2 |
2 |
2 |
2 |
2 |
2 |
2 |
2 |
12 | 24 | |||||
| 3 |
3 |
3 |
3 |
3 |
3 |
3 |
3 |
3 |
3 |
3 |
3 |
3 |
3 |
3 | 15 | 45 | ||
| 4 |
4 |
4 |
4 |
4 |
4 |
4 |
4 |
4 |
4 |
10 | 40 | |||||||
| 5 |
5 |
5 |
5 |
5 |
5 |
5 |
5 |
8 | 40 | |||||||||
| 6 |
6 |
6 | 3 | 18 | ||||||||||||||
| T |
O |
T |
A |
L |
S |
: |
56 |
175 | ||||||||||
Q. Would it be correct to say "the mean number of faults found was 175 ÷ 56 = 3.13"?
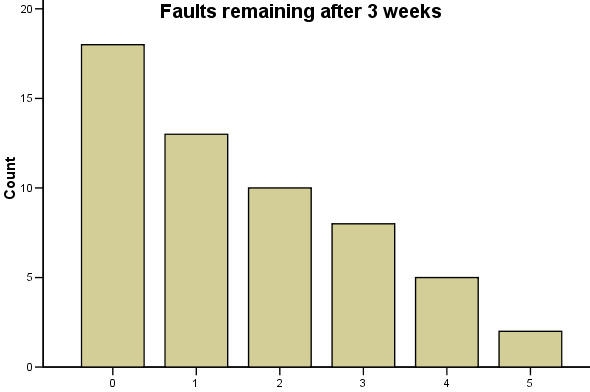
Remaining faults after 3 weeks:
| Remaining
faults (r) |
Number
of cases (f) |
(f)
x (r) = | |||||||||||||||||||
|
0 |
0 |
0 |
0 |
0 |
0 |
0 |
0 |
0 |
0 |
0 |
0 |
0 |
0 |
0 |
0 |
0.. |
0 | 18 | 0 | ||
| 1 |
1 |
1 |
1 |
1 |
1 |
1 |
1 |
1 |
1 |
1 |
1 |
1 |
13 | 13 | |||||||
| 2 |
2 |
2 |
2 |
2 |
2 |
2 |
2 |
2 |
2 | 10 | 20 | ||||||||||
| 3 |
3 |
3 |
3 |
3 |
3 |
3 |
3 | 8 | 24 | ||||||||||||
| 4 |
4 |
4 |
4 |
4 |
5 | 20 | |||||||||||||||
| 5 |
5 | 2 | 10 | ||||||||||||||||||
|
T |
O |
T |
A |
L |
S |
: |
56 |
87 | |||||||||||||
We can immediately calculate the overall % of the required repair works that have actually been done as [175- 87] ÷175 = 50.3%
We can also see from column 1 that the second inspection produced a very different pattern of distribution.
Now fill in this table:
| Value: |
Initial
Faults | Remaining
Faults |
| Mode | ||
| Median | ||
| Mean |
Later in the course we will test for a 'before and after' relationship but for the present we need to rearrange our data into a more manageable format.
Q. Why?
Clue... If we leave the data as it is, we will lose an important element of this data set..
We have learnt nothing about the relationship between number of faults on an individual ride and the number that have been rectified on that ride. We have failed to indicate which ride had which faults. An operator that had to repair 5 faults and has completed the work is in a different situation to the operator who had one fault to rectify and has done nothing about it!
A note about 'paired data'....An important lesson to learn from the above example is that data is often 'Paired'. If we 'uncoupled' the pairing, we could find for example, that a ride with only one fault was reading that five faults still remained after the 3 week period had expired! Your original raw data must always be collected in such a way as to ensure that there is no 'uncoupling'. You need to plan in advance exactly what data you wish to collect, in what format and exactly what you are intending to do with it. Invariably, when data gathering 'in the field' it is impossible to "go back and do it again". In the above example, the reporters would only get one opportunity to investigate those rides secretly. Never be tempted to sort this type of data into ascending order, this would amount to 'uncoupling' and could indicate that 3 initial faults became 5 !! In SPSS it is possible to sort pairs of data into say, ascending order without the two columns becoming uncoupled. The advice here refers to any manual calculations you may be doing rather than to SPSS-based work. In Focus 4 we will look at more advanced ways of analysing paired data.
|
Input the data in SPSS in the same way as in the previous exercise but this time use two variables...'faultin' and 'faultaft'.
Go to 'Graphs', 'Bar...', 'Summaries of Groups of cases'
Transfer 'faultin' to the Category Axis box
Ensure that the 'N of cases' button is selected
Click 'Ok'
To produce the second chart, repeat the above using 'faultaft'
Also available as: SPsmex02 ride faults.
You should now be able to produce the following outputs...
Carry out the same procedure for the second column of data.....
Compare these two outputs with the cumulative frequency charts shown earlier.
Q. Is it reasonable to suggest that this is still a normal distribution?
(You should reflect and make sure that the characteristics of the normal distribution curve are familiar to you.)
This chart is a 'Box and Whisker' chart created in SPSS..... (see Focus 2b for more details of boxplots.)
In SPSS, open the dataset. Drop down 'Graphs', select 'Boxplots' and tick 'Summary of separate variables'
Transfer both variables to the 'Boxes represent' box, click 'OK'.
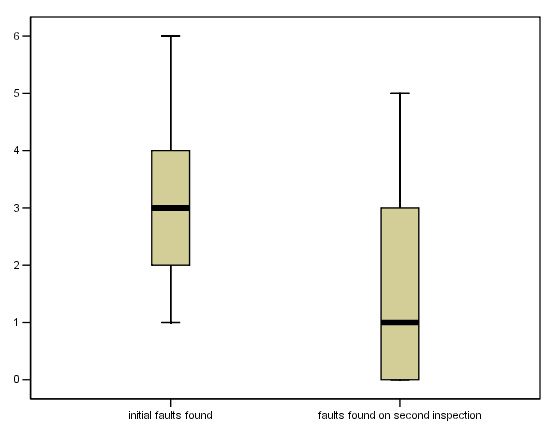
Task: Now see if you can create this output for yourself in SPSS
![]()
On to Focus 3c (interactive page) You will need an Internet connection to fully utilise this page.