
Exploring more advanced methods |
 Congratulations !! You are now ready to explore some of the more exacting techniques
of analysis. The use of these methods (correctly applied) will enhance your work
and give you a deeper insight into your subject and the analysis of the data you
have collected.
Congratulations !! You are now ready to explore some of the more exacting techniques
of analysis. The use of these methods (correctly applied) will enhance your work
and give you a deeper insight into your subject and the analysis of the data you
have collected.
Focus pages 1 -11 were designed to cover all the essential procedures that are necessary in order for you to manipulate, describe and begin the process of making inferences from a wide range of types of collected data.
In
this next section, it will become increasingly apparent that the capabilities
of inferential statistics
run deep. As a consequence, the maths becomes more
involved and so there is a much greater reliance placed upon the use of SPSS.
Whilst there are many other programmes capable of statistical analysis and some
with very specific specialist contents(e.g. GenStat 8), SPSS v11/12/13 should
be regarded as an 'Industry standard' for this type of work.
There will now be less emphasis on manual calculations because they would simply be to long and complicated.
Focus 12 explores multiple regression (simple regression was covered in Focus 11) using 3 or more variables. We will be using two independent variables (predictors) and one dependent variable. Both Excel and SPSS can be used for this type of analysis. We can use any number of independent variables but there can only be one dependent variable under scrutiny at a time.
Focus 13 gives an introduction to the Analysis of variance:ANOVA; and the derivatives. This is potentially a vast topic and one that is increasingly used in science and business research.
You will recall that t-tests are used to test for differences between the means of two samples. Analysis of Variance is an extension to this concept in that it allows us to test for significant differences between 3 or more sample means and additionally; where that significance might lie.
Suppose we were dealing with 4 samples, we might find a significant difference between the means of the four samples as follows:
P =
A | B | C | D | |
A | N/S | .05 | .01 | |
B | .05 | N/S | ||
C | 0.10 | |||
D | ||||
So we could say that the highest significant difference was between samples A and D
The other main issue of whether the observed differences between the sample means has occurred by chance (through sampling fluctuations for example) or whether the differences are so large that it is unlikely that they occurred by chance.
There are at least 5 subgroups of ANOVA and although it is not intended that we look at all versions, we will look at one-factor in order to cover the basic concepts.
Focus 13a deals with the Kruskal-Wallis test which is the non-parametric test commonly used when three or more samples of Ordinal (scores) data are involved. This time, we will be searching for a significant difference between scores by looking at the mean rank values. The test is often used in the analysis of questionnaires.
The Friedman test also appears on this page. Much as the relationship between the Mann-Whitney test for unmatched pairs related to the Wilcoxon test for matched pairs; so with non-parametric ANOVA tests. The Kruskal-Wallis test relates to the Friedman test.
These are all tests for Ordinal data.
Number
of pairs | 2
pairs | more
than 2 pairs |
Are
they Unmatched pairs? | Mann-Whitney
| Kruskal-Wallis |
Are
they Matched pairs? | Wilcoxon | Friedman |
So essentially the Friedman test is used when you want to use the same sample of subjects or cases and assess them at three or more points in time or under differing conditions.
Not only will these techniques be useful to the researcher but they will also give you practice and experience in manipulating large datasets.
The final 5 Focus pages are what we might call 'exploratory techniques'.....they do not rely upon putting forward a hypothesis for testing and verification. Instead, they are ways to 'explore' data, to find hidden trends, to distill the core information that might be 'buried' in a data set and in some instances, to predict which group a particular case might belong to.
Focus 14 we look at Principal Component Analysis which is a multivariate technique that allows us to examine a matrix of correlation coefficients (for three or more variables) all at the same time!! It is a difficult concept to grasp but the idea is that the the number of variables 'in play' is distilled in such a way as not to loose any of the deepest information contained within the original dataset. The term often employed here is 'dimension reduction'. The procedure works by 'extracting', those variables most responsible for the bulk of the variance displayed. They are highlighted and their relative importance is exposed. We will then deduce the multi-dimensional nature of the data and look for evidence of 'clustering' within the data. No 'natural groupings' are assumed prior to the analysis.
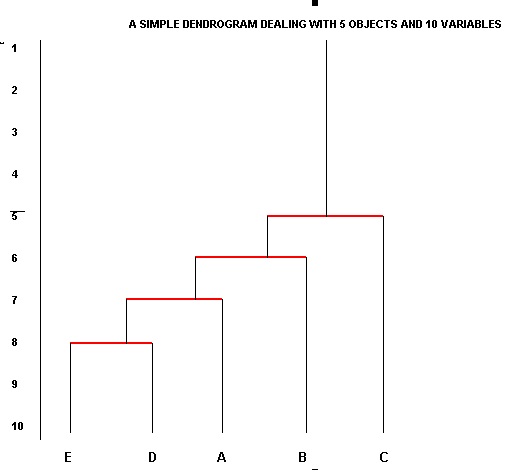
In Focus 15, another type of data reduction is explained: Hierarchical Cluster Analysis. This is derived from the historical idea of using specific (usually visible) characteristics to 'pigeonhole' objects into their 'natural groups'. Cluster analysis deliberately sets out to highlight any natural groupings that may exist. Two complementary Non-Parametric techniques are explained here; one just looks at similarities between objects and the other looks at similarities and differences. The concept and use of Dendrograms is explained.....
Focus 16 explains yet another technique for 'pigeonholing individual cases. Discriminant analysis takes the issue of "which group does an object belong to" one stage further. Groups are now assumed a priori in this analysis. As with PCA, the key idea to grasp is that each variable (that remains represented as the analysis progresses) contributes an influence and those influences become distilled into 'components'. By extracting those new 'components' (from the variables) that contribute the most to the observed variation, it is possible to measure and maximise the 'distance' between all the groups. By then gauging those same parameters for each object it is possible to 'lock' each object onto the most appropriate grouping. We can produce 2D (and sometimes 3D) plots which will show the results of this manipulation as 'clouds' of data points.
Focus 17, Binary Regression is yet another method that attempts to predict which category an individual case might belong to. Most importantly, qualitative variables such as gender and hair colour can also be incorporated in this type of analysis. For SPSS use though, the different states of each variable has to be coded. The coding has absolutely no hierarchical merit and is simply a device for "getting the data into the computer"....
Brown
hair | 1 |
Blonde
hair | 2 |
Red
hair | 3 |
Black
hair | 4 |
White
hair | 5 |
Chestnut
hair | 6 |
In Focus 18, we discuss Time Series Analysis. This large subject looks specifically at how an individual variable can change and fluctuate over time....and more specifically; can we use this information to predict the future? The concepts of 'Trend', extrapolation and types of variability are introduced. We also examine various tchniques for 'smoothing' highly fluctuating data to reveal the underlying trend.
![]()
Go back to 'quick view' Contents page